Mid-2024 population estimates were published on 14 August 2025. The population of the Outer Hebrides is estimated to have decreased from 26,040 to 26,020 from 30 June 2023 to 30 June 2024. This is a decrease of 0.1%, 20 people (Scottish average 0.7% increase). The Outer Hebrides is one of five local authority areas with a decrease in population. Argyll & Bute saw the highest decrease at 0.3% (270 people).
The decrease is driven by two main components: natural change and net migration. Natural change (births minus deaths) was negative at -220. There were 173 births and 393 deaths. However, net migration (number of people moving into an area minus the number of people leaving) was positive with a total of 200.
Of the 32 council areas in Scotland, Glasgow City had the highest population (650,300), followed by City of Edinburgh (530,680). The three island council areas had the lowest populations (Outer Hebrides with 26,020, Shetland Islands with 23,190, and Orkney Islands with 22,000). Orkney’s population remained unchanged while Shetland’s population increased by 0.4% (90 people).
The Outer Hebrides had the 3rd highest percentage of those aged 65 and over at 27.4%, along with the Scottish Borders. Dumfries and Galloway had the highest at 28%. The Outer Hebrides had the 5th lowest percentage of those aged 16-64 at 58%. Dumfries and Galloway had the lowest at 57.2%. The Outer Hebrides had the 3rd lowest percentage of children aged 0-15 at 14.6%. Argyll and Bute had the lowest percentage at 13.9%. The highest figures are in areas which border the cities, with East Renfrewshire highest at 20%.
Over the decade to mid-2024, the Outer Hebrides had the highest decrease of children aged 0-15 with a decrease of 13%. Over the same period the Outer Hebrides also had the highest decrease in those aged 16-64 with a decrease of 7.8%.
Females represent 50.4% (13,120) of the population in the Outer Hebrides, while males represent 49.6% (12,900). The median age has increased to 51.51 years (Scottish median age 42.76) while the female median age is 52.29 (Scottish median 43.74) and for males 50.76 (Scottish median 41.72).
The population density (usual residents per square kilometre) is lowest in the Outer Hebrides and Highland region at 9, while Glasgow City is the highest at 3,724.
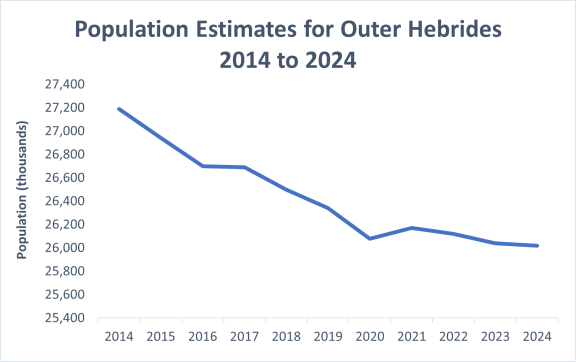
The chart above shows that the population of the Outer Hebrides has decreased by 4.3% over the ten-year period from 2014 to 2024. The population has decreased by 1,170 people from 27,180 in 2014 to 26,020 in 2024.
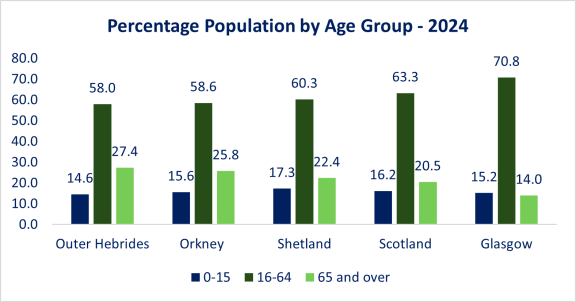
Age structure varies across Local Authority areas. The Outer Hebrides has one of the lowest percentages in the 0-15 and 16-64 age groups. The Outer Hebrides has had the highest decreases over the decade in these age groups.
Scotland’s population is ageing. An estimated 20.5% of the population were aged 65 and over, an increase from 16.2% in the two decades since 2004. An estimated 16.2% were aged 0 to 15 years, a decrease from 18.4% in 2004.
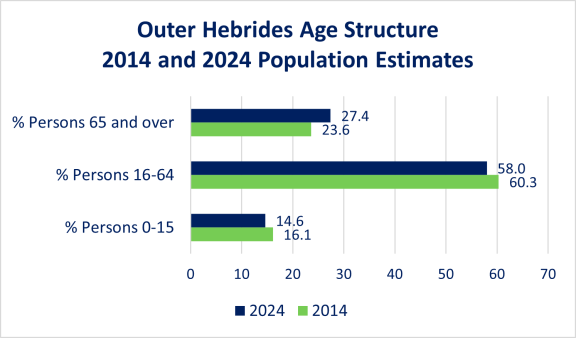
The chart shows the change in the age structure in the Outer Hebrides over the decades from mid-2004 (population 27,180) to mid-2024 (population 26,020), highlighting the growth in those aged 65 and over and the decrease in the percentage of those aged 0-15 and those aged 16 to 64.
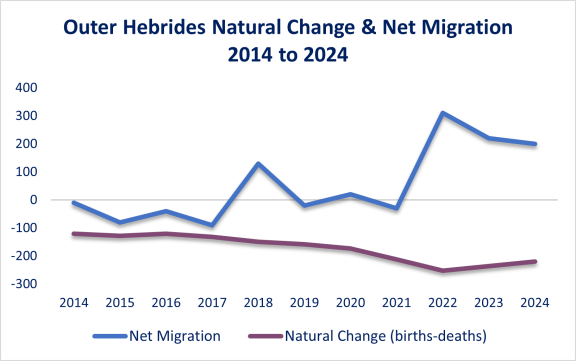
It is important that the Outer Hebrides continues to see positive net migration. Net migration has been high over the last 3 years with figures of 200 to 310. Without this, the population of the Outer Hebrides would have decreased further due to the continuing negative natural change. The gap between births and deaths is wide and continues to be so.
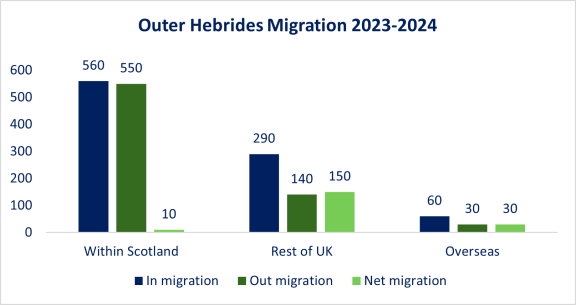
More people moving to the Outer Hebrides is the main reason our population is growing. We’ve seen small increases from people moving here from other parts of Scotland, and from overseas, and a larger increase from the rest of the UK. To keep our communities thriving, we need to continue encouraging people to return to the islands or to make them their new home.
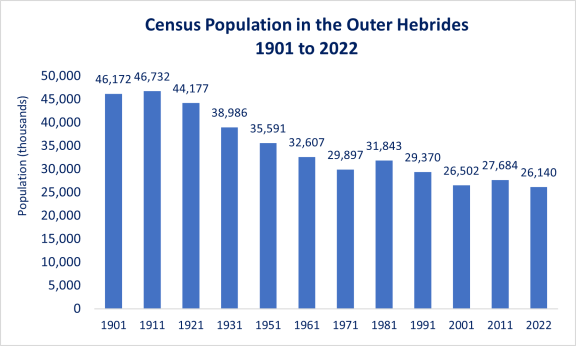
The continuing trend in the Outer Hebrides is of a decreasing population. Over the period 1901 to 2022 there has been a 43% decrease in the population. Along with that decrease, the age structure has changed so that there are less people aged 0-15 and more people aged 65 and over.
The only large town in the Outer Hebrides is Stornoway (Steòrnabhagh) with approximately 7,000 people (as at 2022 Census) in the Stornoway settlement. In 2020, almost all of Glasgow City’s and Dundee City’s population lived in a settlement (99.8% in both). In contrast, less than a third of the Outer Hebrides population lived in a settlement (29.4%). The remaining population is scattered throughout over 280 townships. Stornoway is the only settlement, which can really be described as having any 'urban' characteristics.